PMG Chart Widget Updates
We’ve mapped it out for you
Dashboards need to display a lot of data. The challenge that PMG designers and builders face is making the data meaningful and actionable to the audience.
To help with this, we’ve added some new features to Chart Widget in v21.3, including:
- Polar Area charts for better view of recurring events
- Point Radius setting for defined chart plotting
- Data drill down
- Updated legend colors
- Advanced Options for custom JavaScript
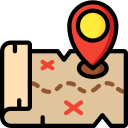
Polar Area is a new addition to our chart types. Polar Area charts are like pie charts, but each sector uses equal angles and differs in how far out each sector extends from the center of the circle. This type of chart is particularly beneficial in plotting cyclic phenomena.
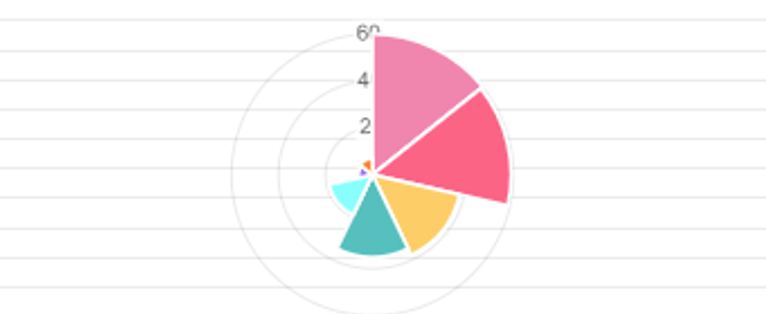
Point Radius is a new setting that appears when the chart type is line or radar. This setting defines the size of the points used on the graph. If you set the point radius to 0, it hides the points on a line chart, while a higher number makes the points thicker.
Below is an example of a 0-point radius:
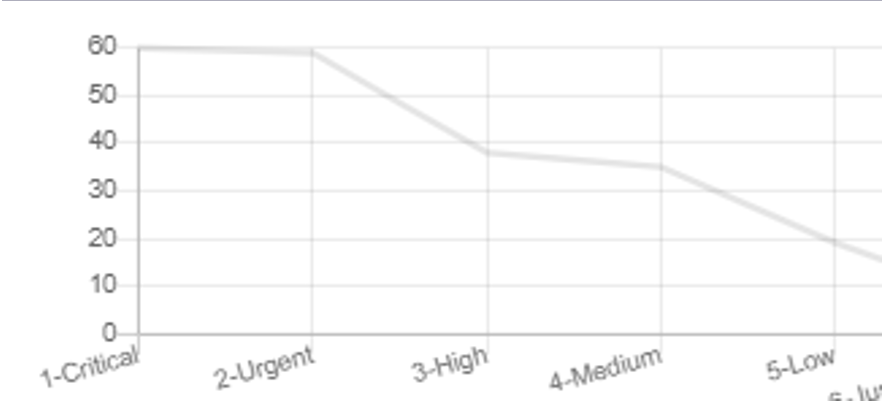
As opposed to an example of a 3-point radius:
Legend colors now appear as circles as opposed to rectangles when the setting is enabled.
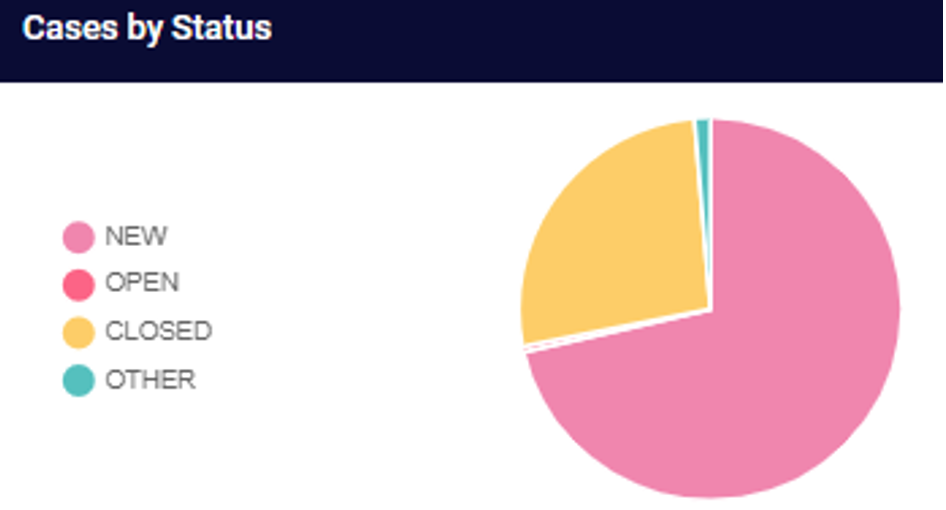
Even more exciting, we now have an easier way to drill down into the chart data. In the Drilldown section of the chart properties, you will need to set the App Page where the user will be directed to when they click on a data point in the chart. The data can be set to appear in a Modal window or open a new tab.
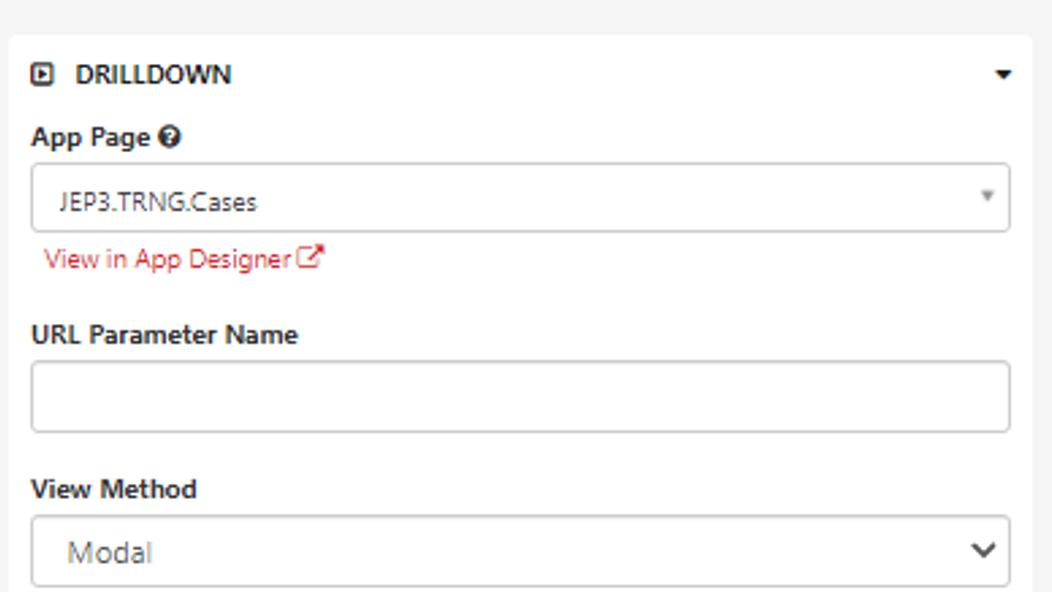
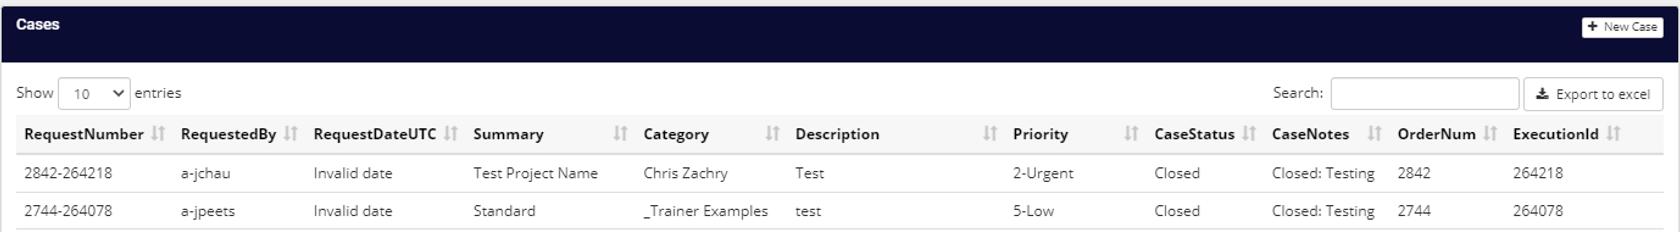
For instance, with the example settings above, it is possible to open a Modal window with the specific chart data when clicking on a data point.
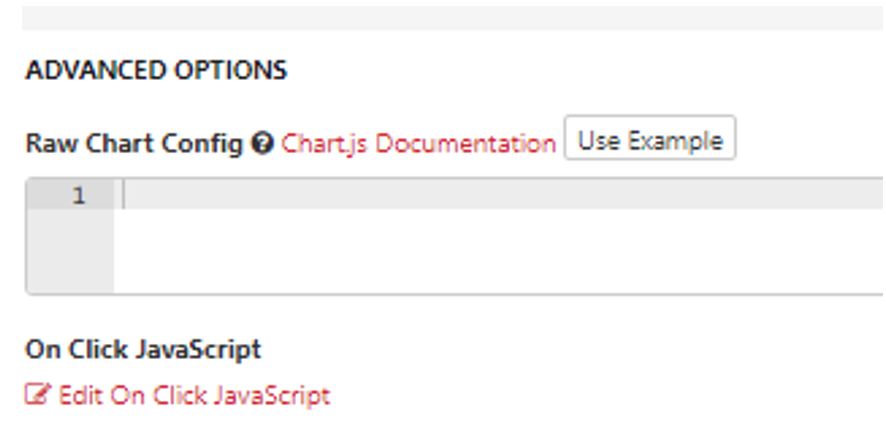
Finally, for those who are technically bold and adventurous, we have Advanced Options where custom JavaScript can be written to render a chart_js object. This isn’t for the faint of heart, but if you utilize this, we’d love to see what you come up with!
We hope this helps you feel a little more comfortable navigating the updates to our Chart Widget.
