Isolate those pesky workflow bugs
Step through workflow processing for more effective troubleshooting
![]()
Testing workflows or portions of workflow logic can be complicated when trying to debug them. Maybe you want to be able to step through it at your own pace and not at the pace of the workflow engine.
Let us introduce you to Workflow Breakpoints. Used in conjunction with Workflow Execution Debugging, breakpoints allow you to halt the workflow engine, stopping workflow processing at set breakpoints.
By allowing you to control the pace and step through each breakpoint, you’re able to analyze the process up to that point and at each step.
Start with opening up the Process Details of a request, or use the Deploy and Play option in the Workflow Designer.

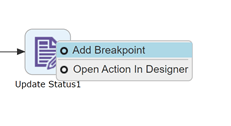
Next, select the action where you want to set a breakpoint. To set a breakpoint in a diagram, right click any action and choose Add Breakpoint.
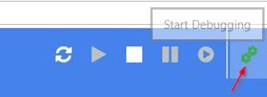
Then enable Workflow Execution Debugging by toggling the gear icon in the workflow diagram.
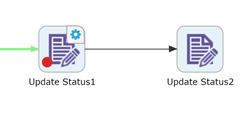
When in debug mode, the action will indicate it has been set as a breakpoint. When the workflow proceeds to this step, execution will pause.
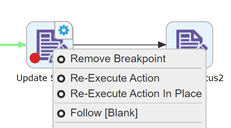
Once paused, the workflow can be “stepped” to proceed with the execution path and run the pending action. It will then pause again at the next step.
Debug points can be removed similarly, by right clicking the action again and choosing Remove Breakpoint. This will cause the workflow to resume.
Now you can isolate workflow processing easily, making troubleshooting easy*(ier) too!
